blob: b7afad0f9822e6806ad540cd8febc9ccb3e7714f (
plain)
1
2
3
4
5
6
7
8
9
10
11
12
13
14
15
16
17
18
19
20
21
22
23
24
25
26
27
28
29
30
31
32
33
34
35
36
37
38
39
40
41
42
43
44
45
46
47
48
|
# Profiler Plugin
Profiling is mainly the runtime analysis of a program performance by counting
the calls and duration for the various routines executed thru the lifecycle
of the application. For more information view the [wikipedia] article.
This plugin adds the ability to profile function calls while running Lite XL,
becoming easier to investigate performance related issues and pinpoint what
could be causing them. It integrates the [lua-profiler] which provides
the functionality we need.
## Usage
Open Lite XL and access the command palette by pressing `ctrl+shift+p` and
search for `profiler`. The command `Profiler: Toggle` will be shown to let you
start or stop the profiler. You should start the profiler before triggering
the events that are causing any performance issues.

> **Note:** Starting the profiler will make the editor slower since it is
> now accumulating metrics about every function call. Do not worry, this is
> expected and shouldn't affect the end result, just be patience because
> everything will be slower.
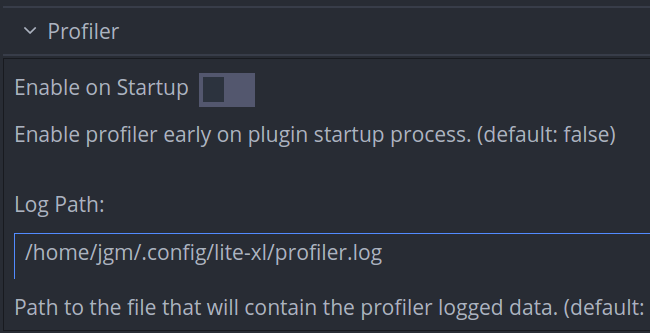
There may be some situations when you would like to enable the profiler
early on the startup process so we provided a configuration option for that.
Also the profiler output is saved to a log file for easy sharing, its default
path is also configurable as shown below:

> **Note:** since the profiler is not part of the core, but a plugin, it will
> only start accumulating metrics once the plugin is loaded. The `priority`
> tag of the profiler plugin was set to `0` to make it one of the first
> plugins to start.
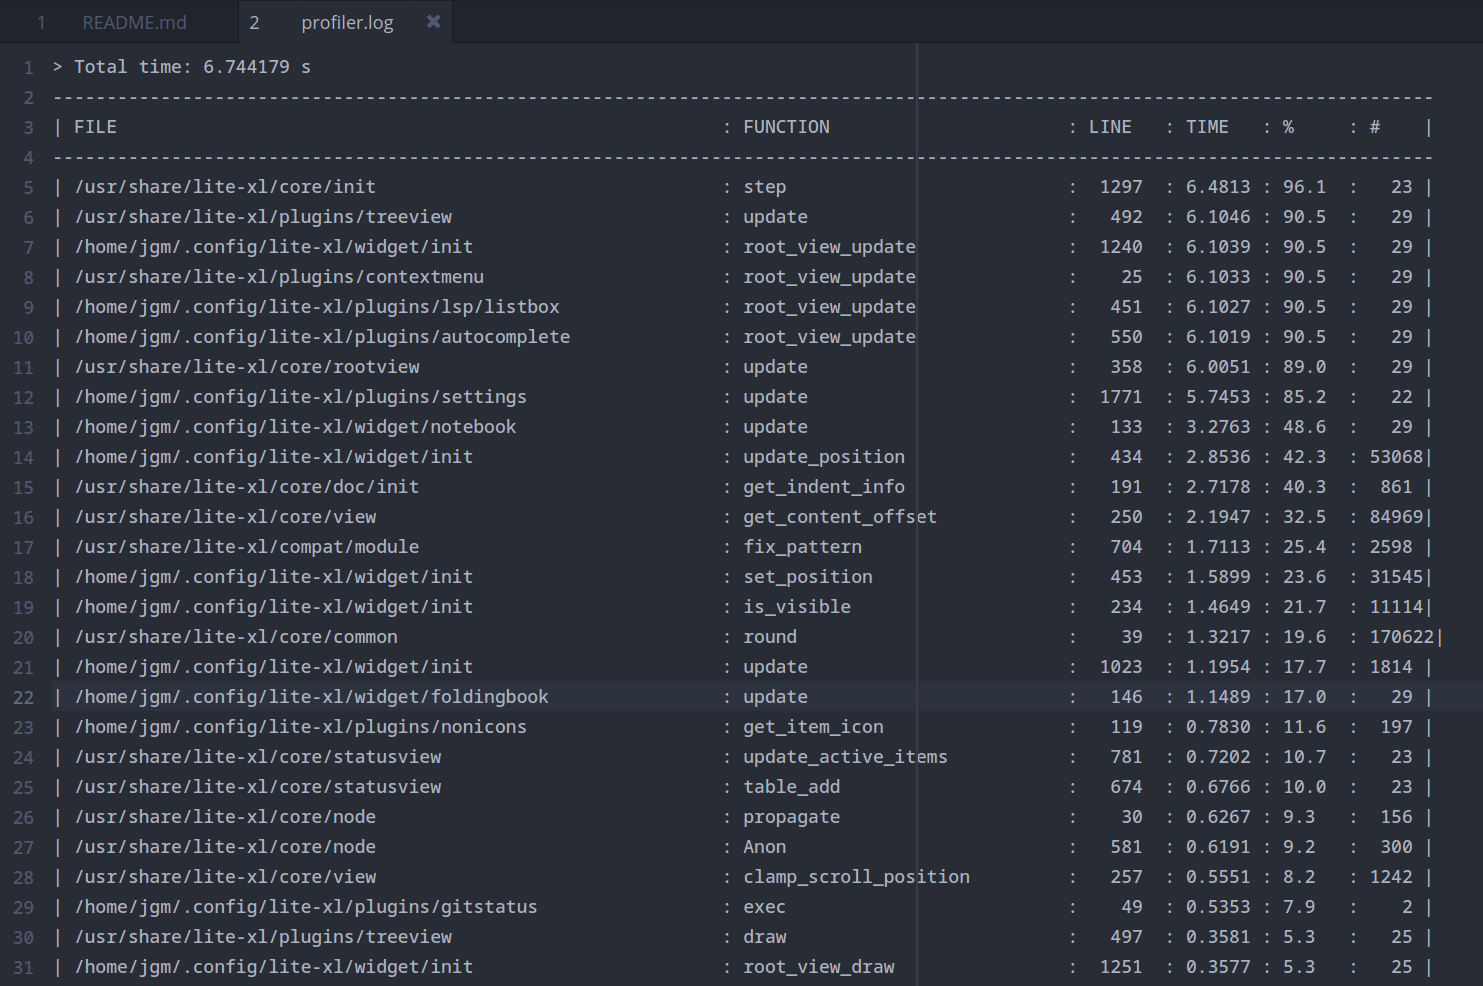
Once you have profiled enough you can execute the `Profiler: Toggle` command
to stop it, the log will be automatically open with the collected metrics
as shown below:

You can send Lite XL developers the output of `profiler.log` so it can be
more easily diagnosed what could be causing any issue.
[wikipedia]: https://en.wikipedia.org/wiki/Profiling_(computer_programming)
[lua-profiler]: https://github.com/charlesmallah/lua-profiler
|
