diff options
| author | jgmdev <jgmdev@gmail.com> | 2022-11-17 11:29:48 -0400 |
|---|---|---|
| committer | jgmdev <jgmdev@gmail.com> | 2022-11-17 11:29:48 -0400 |
| commit | 2e471e67b2f0535b2f7159a0d46f02c115b4f075 (patch) | |
| tree | d0f477a3ef5ed976d45f5844eec2b7528962a35c /plugins/profiler/README.md | |
| parent | dc2aea6f69cc2443d9992d93b1fc4a94ba208794 (diff) | |
| download | lite-xl-plugins-2e471e67b2f0535b2f7159a0d46f02c115b4f075.tar.gz lite-xl-plugins-2e471e67b2f0535b2f7159a0d46f02c115b4f075.zip | |
profiler: rephrased parts of the readme
Diffstat (limited to 'plugins/profiler/README.md')
| -rw-r--r-- | plugins/profiler/README.md | 34 |
1 files changed, 18 insertions, 16 deletions
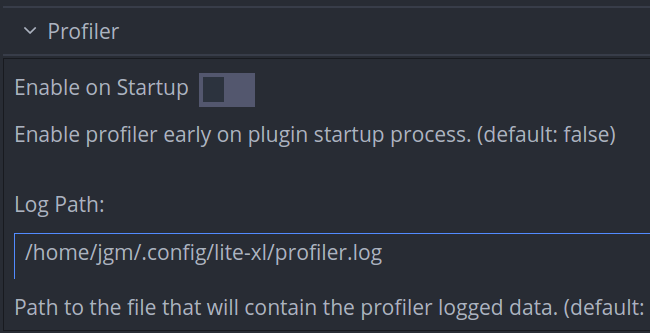
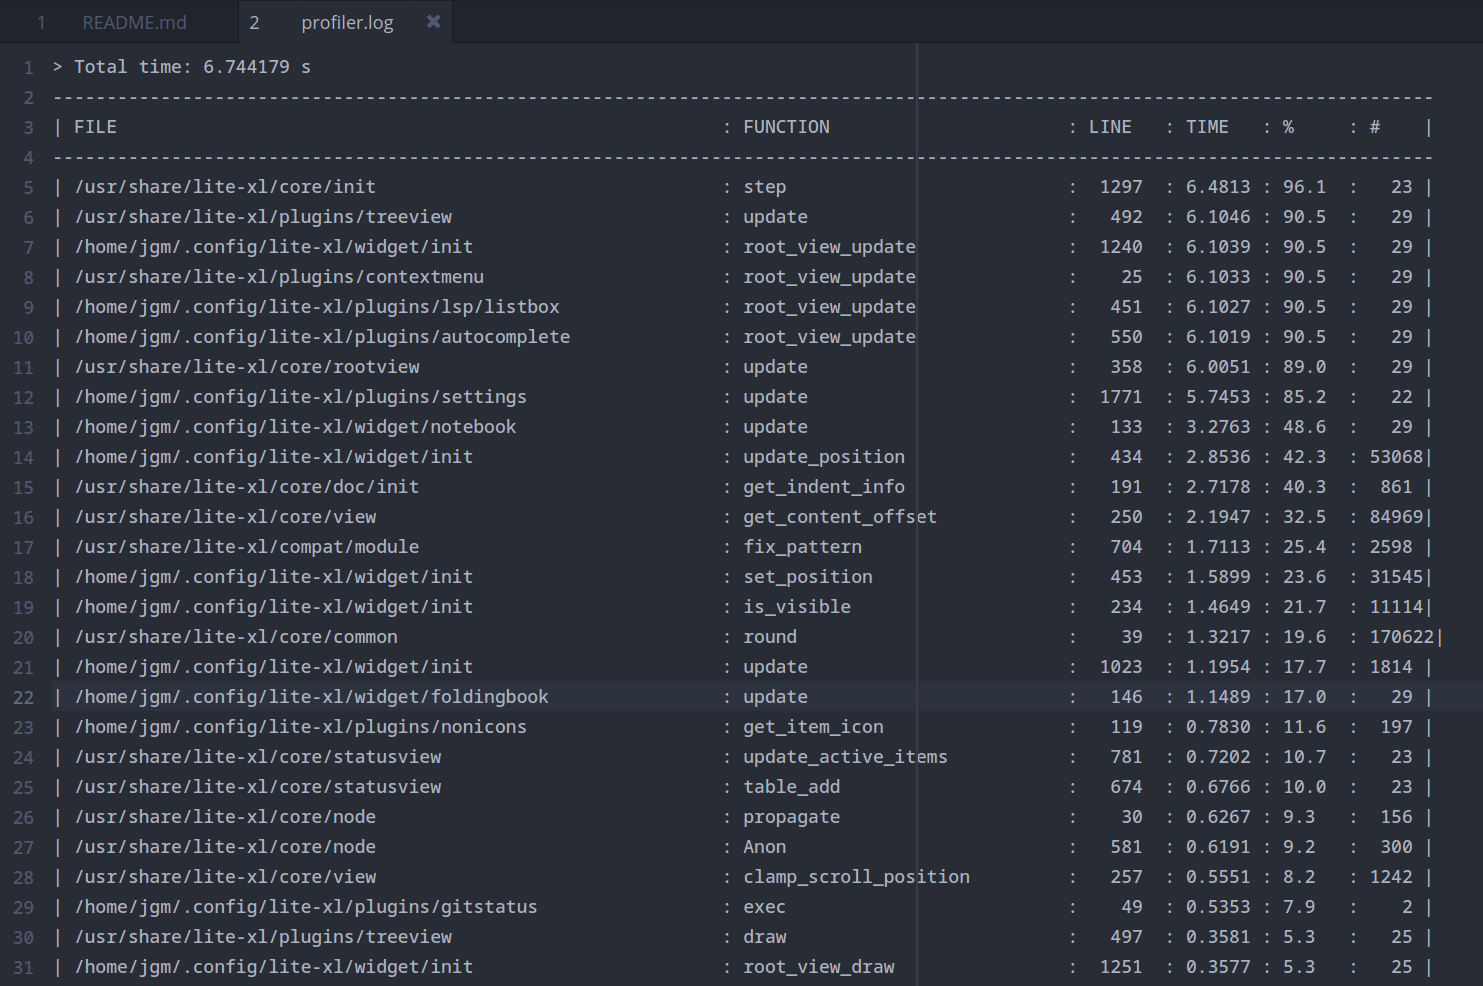
diff --git a/plugins/profiler/README.md b/plugins/profiler/README.md index 4f113b8..b7afad0 100644 --- a/plugins/profiler/README.md +++ b/plugins/profiler/README.md @@ -1,41 +1,43 @@ # Profiler Plugin Profiling is mainly the runtime analysis of a program performance by counting -the call count and duration for the various routines executed thru the lifecycle +the calls and duration for the various routines executed thru the lifecycle of the application. For more information view the [wikipedia] article. -This plugin adds the ability to profile function calls while running Lite XL -to investigate performance related issues and more easily pinpoint what could -be causing the slowdowns. It integrates the [lua-profiler] which provides +This plugin adds the ability to profile function calls while running Lite XL, +becoming easier to investigate performance related issues and pinpoint what +could be causing them. It integrates the [lua-profiler] which provides the functionality we need. ## Usage Open Lite XL and access the command palette by pressing `ctrl+shift+p` and -search for profiler. The command `Profiler: Toggle` command will be shown to -lets you start or stop the profiler. You should start the profiler before -triggering the events that are causing any performance issues. +search for `profiler`. The command `Profiler: Toggle` will be shown to let you +start or stop the profiler. You should start the profiler before triggering +the events that are causing any performance issues.  -> **Note:** Starting the profiler will make the editor more slower since it is +> **Note:** Starting the profiler will make the editor slower since it is > now accumulating metrics about every function call. Do not worry, this is > expected and shouldn't affect the end result, just be patience because > everything will be slower. -There may also be some situations when you would like to enable the profiler -early on the startup process so we provided a config option for that. +There may be some situations when you would like to enable the profiler +early on the startup process so we provided a configuration option for that. +Also the profiler output is saved to a log file for easy sharing, its default +path is also configurable as shown below:  -You can also change the default `profiler.log` path. Notice that since the -profiler is not part of the core but a plugin it will only start measuring -metrics once the plugin is loaded. The `priority` tag of the profiler plugin -was set to `0` to make it one of the first plugins to start. +> **Note:** since the profiler is not part of the core, but a plugin, it will +> only start accumulating metrics once the plugin is loaded. The `priority` +> tag of the profiler plugin was set to `0` to make it one of the first +> plugins to start. Once you have profiled enough you can execute the `Profiler: Toggle` command -to stop the profiler and it will automatically open a document view with the -recollected metrics as shown below: +to stop it, the log will be automatically open with the collected metrics +as shown below:  |
